Remote debugging Code Tester
Quest Code Tester for Oracle (Code Tester) helps you with defining test cases, generating test harnesses and presenting the test results in a structured way. Code Tester does not provide any features to debug your code. If you run into a red light situation when a test case fails, you have discover where the error is located. This means checking inputs and outcomes in order to exclude incorrect setup and incorrect initialization code. And of course checking your code, recompiling your (test) code and login again.
If this does not result into a green light, it is time to debug your code with a development IDE. As a result you have to transfer your test code into your development IDE. Wouldn't it be nice if you could enter debug mode seamlessly: when executing your test case the execution stops at a breakpoint and you can debug your code. The answer is: yes, you can. With SQL Developer you can remote debug your code within a test run.
The linking pin between Code Tester and SQL Developer is the package sys.dbms_debug_jdwp where jdwp stands for Java Debug Wire Protocol. This protocols needs a debugger process i.e. SQL Developer and a debuggee process i.e. Code Tester. The debugger listens for requests from the debuggee i.e. PL/SQL package procedure calls to connect_tcp and disconnect.
Setting up the debuggee
In Code Tester you have to modify the initialization section of your test case. Add the following codedbms_debug_jdwp.connect_tcp(host => '127.0.0.1', port => 4000);
The first parameter is your IP address of the client where the Code Tester IDE runs (as seen from the database server you're connected to). Because I'm running Code Tester and Oracle XE on the same machine, I use the local host address 127.0.0.1. The second parameter is the default port. An alternative for the hard coded IP address is SYS_CONTEXT ('USERENV', 'IP_ADDRESS').
After the test case is executed, switch off remote debugging. Add the following code to the cleanup section:dbms_debug_jdwp.disconnect;
Setting up the debugger
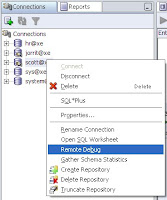
In SQL Developer login with the same user as Code Tester and right click on your connection, a context menu appears and select the 'Remote Debug' option. A small window with the title 'Debugger - Listen for the JPDA' (Java Platform Debugger Architecture) appears, enter the address or host name where SQL Developer should listen to connect. Use the same IP address as in dbms_debug_jdwp.connect_tcp. Also check if the port is the same.


Before switching to Code Tester again set a breakpoint in your code (and compile your code for debug) otherwise the debugger will not stop at your breakpoint. At last but not at least make sure the user has the debug connect session privilege and the debug any procedure when debugging other users objects.
Debugger meets debuggee
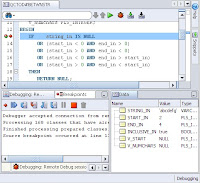
It is time to run your test with Code Tester. SQL Developer will stop on your breakpoint. Note: while debugging your code Code Tester will not respond. After stepping through your code press the resume button in SQL Developer to return to Code Tester. As an example I modified the code of the normal usage test case of the function qctod#betwnstr (see for an explanation and the source code How Quest Code Tester for Oracle can help you get rid of bugs in your PL/SQL procedures). In the picture below SQL Developer hits the breakpoint at line 13. In the data tab you can see all variables and their values.

This example shows how to use remote debugging with Code Tester. Instead of using SQL Developer as debugger you can also use Toad for Oracle or Jdeveloper. And also every front end can be used as debuggee for remote debugging as long the calls to dbms_debug_jdwp can be implemented. Let's start debugging!
I found the following links usefully while writing this blog entry:
The basics explained: Remote Debugging with SQL Developer
Remote debugging and Application Express: Wonder twin powers activate!
Comments in the package specification of
SYS.DBMS_DEBUG_JDWP- Debugging PL/SQL and Java Stored Programs with JPDA


